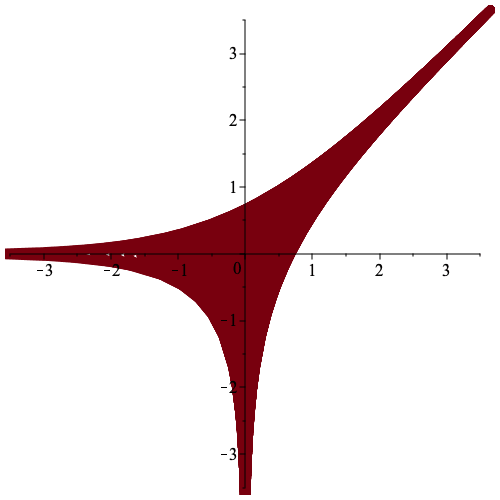
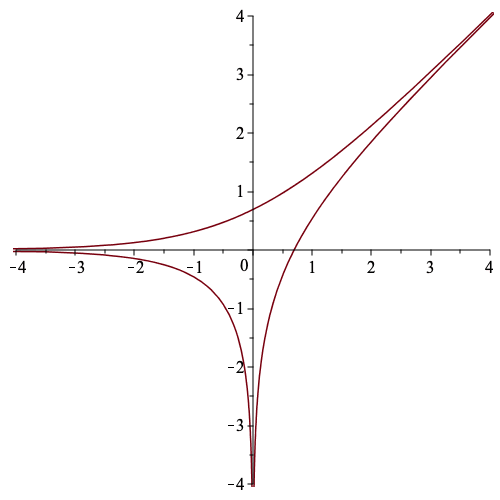
Examples 3.17 and 18 (A Prototypical Amoeba and Contour)
| > | # Define H
H := 1-x-y; |
| (1) |
| > | # Plot the amoeba
X := solve(H,x); pt := subs(y=r*exp(I*t),[log(abs(X)),log(abs(y))]): PTS := seq(plot([op(subs(t=k*Pi/90,pt)),r=-40..40],thickness=7),k=0..89): plots[display](PTS, view=[-3.5..3.5,-3.5..3.5]); |
 |
| > | # Plot contour
sbs := solve([diff(H,x)*x-diff(H,y)*y*t,H],[x,y])[1]: cc := subs(sbs,[log(abs(x)),log(abs(y))]); plot([op(cc),t=-100..100], view=[-4..4,-4..4]); |
 |